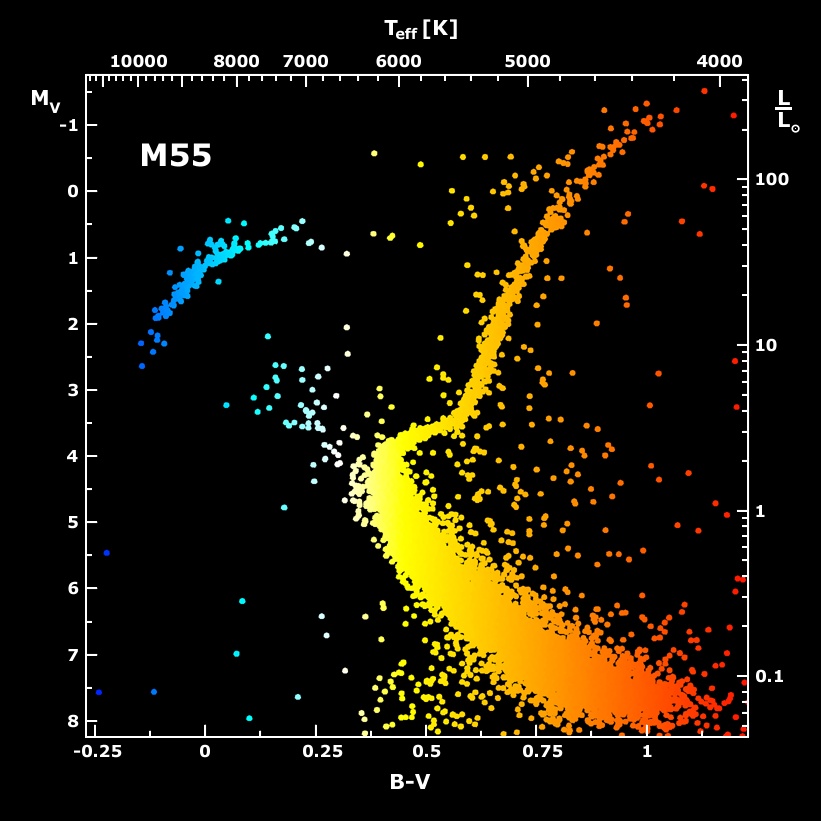
M55: Color Magnitude Diagram
This color "picture" of
globular star cluster M55
may not look like any star cluster you've ever seen.
Still, it shows a most fundamental view for students
of stellar astronomy.
In the picture, a
Color Magnitude Diagram (CMD),
M55's individual stars
are represented as dots whose
color indicates relative temperature,
red (cool) to blue (hot).
Position in the CMD does not correspond to a star's location
in the sky, though.
Instead, it corresponds to a measured
astronomical color,
(B-V color) read off the bottom scale, and a
brightness in
magnitudes (M) on the left hand scale.
The temperature for each star can also be found by
reading the equivalent scale at the top, where
the Sun would have a temperature of 6,000
kelvins (K).
Brightness relative to the Sun's luminosity (Sun = 1)
is given on the scale at the right.
The globular cluster stars clearly fall into
distinct groups dramatically visible in this CMD.
The broad swath extending diagonally from the lower right is
the cluster's main sequence.
A sharp turn toward the upper right hand corner follows the
red giant branch while the
blue giants are found grouped in the upper left.
M55's stars were formed at the same time and at
first were all located along the main sequence by mass,
lower mass stars at the lower right.
Over time, higher mass stars
have
evolved off the main sequence
into red, then blue giants and beyond.
The exact position of the sharp turn-off from the
main sequence to the red giant branch
measures
the cluster's age.


